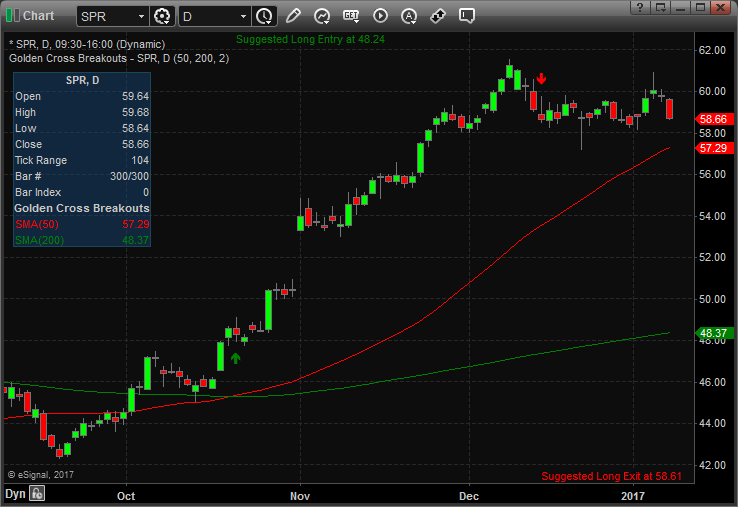
The chart displays a classic golden cross trading example. The blue line on the chart is a 50-period SMA, while the red line is the 200-period SMA.
The chart begins with a strong downtrend, where the price action stays beneath both the 50-period and 200-period SMA.
Suddenly, the direction of the trend changes and price begins making a move to the upside. Naturally, the 50-period SMA reacts faster to the price change as it has a greater sensitivity to the most recent price action.