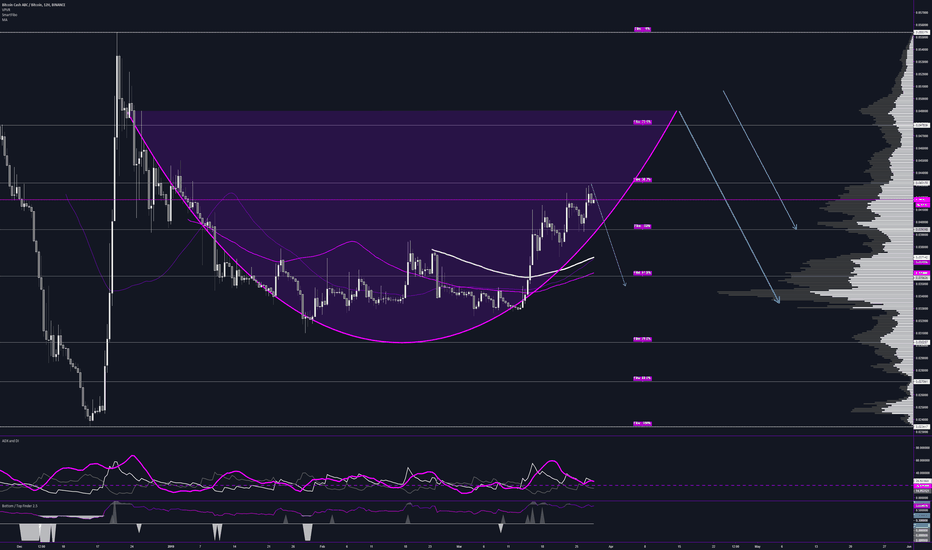
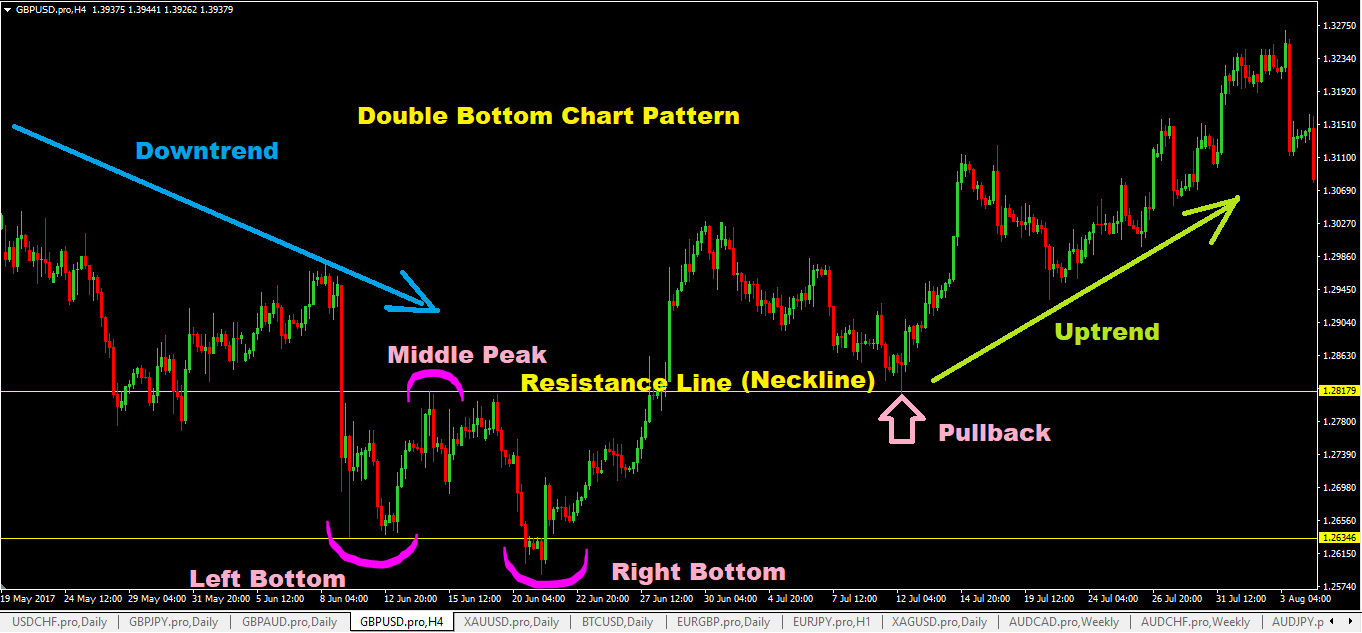
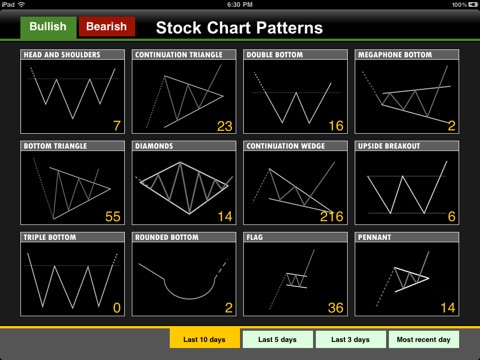
Chart patterns occur when the price of an asset moves in a way that resembles a common shape, like a triangle, rectangle, head, and shoulders, or a cup and handle. These patterns are a visual way to trade. They provide a logical entry point, stop losslocation for managing risk, and a price target for exiting a profitable trade.